Most volunteer programs have a list of past volunteers, but fewer than half use it to bring them back
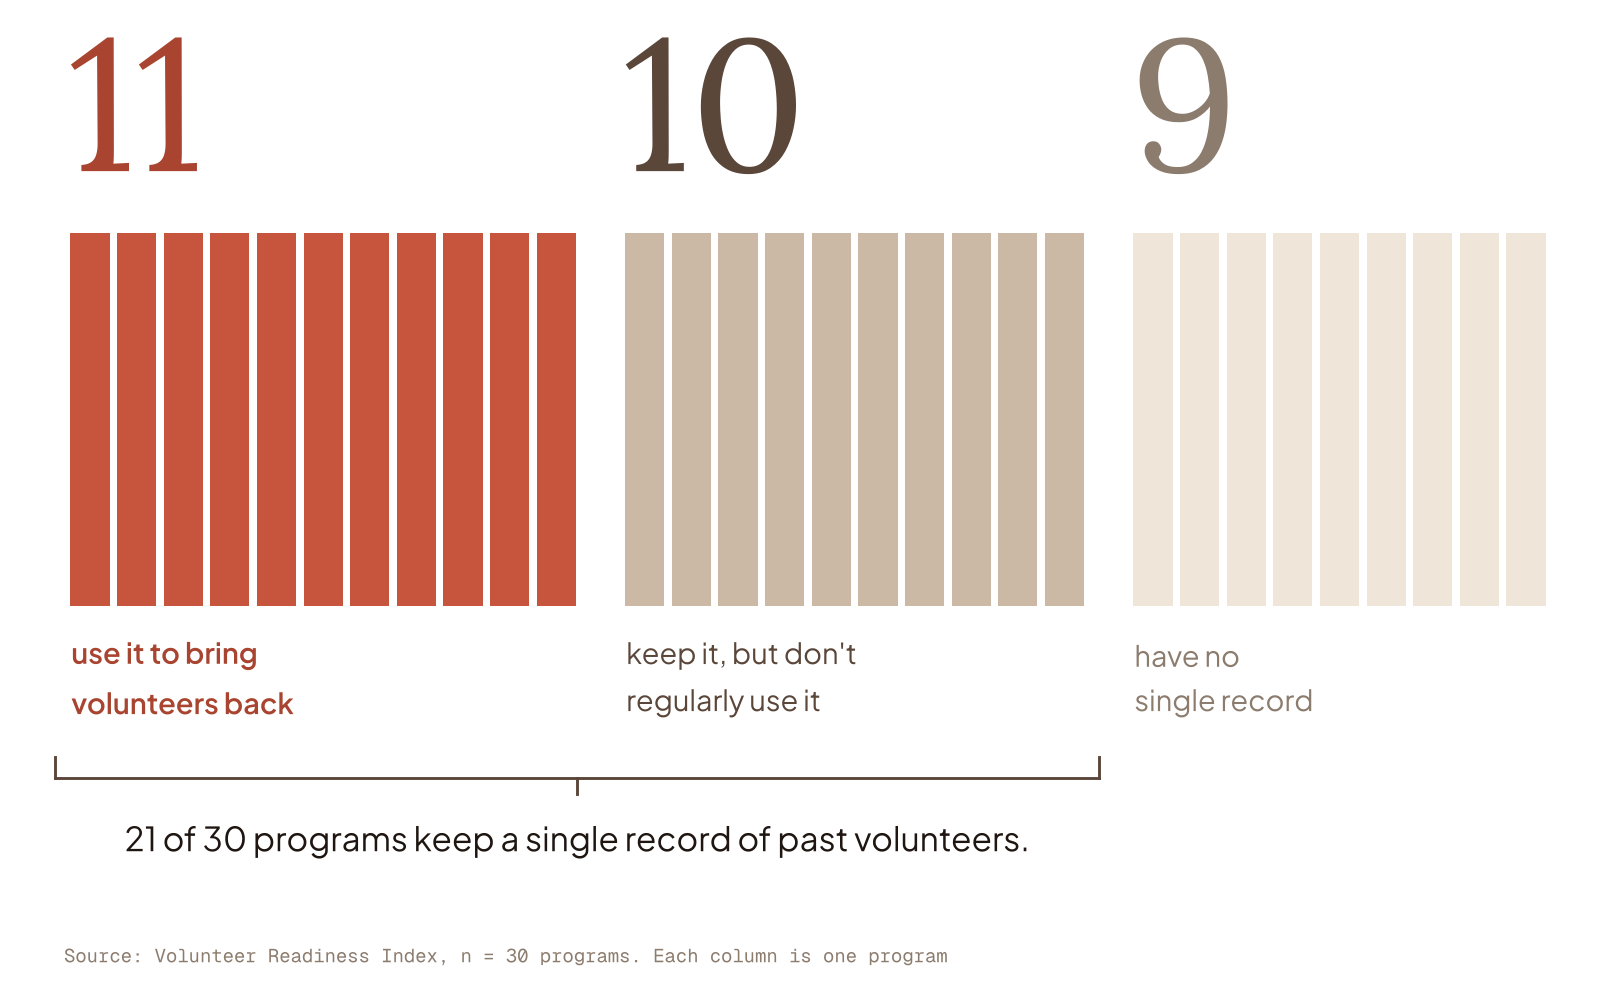
21 of 30 programs keep a single record of past volunteers, but Re-engagement Cadence scores only Functional, on average, and just 13 use that data to re-engage anyone.
By Jalen A. Small · · Data as of October 31, 2026 · n = 30
Context
As nonprofits head into the holiday season, many are already strategizing on how to fill the extra shifts that come with food drives, toy drives and year-end events. Most of that planning starts with the same question: where can we find new volunteers? Typical answers involve new outreach campaigns, a fresh push on social media, or a partnership with a local school or employer, but one of the most effective (and overlooked) sources of holiday volunteer talent may already be sitting right in your program coordinator's computer. Before searching for new faces this season, volunteer program teams should try developing a strategy to bring back volunteers who have already served.
Asking people who have already volunteered to return is one of the most effective recruitment strategies a program has. People who have volunteered once usually want to come back: in a study of people who volunteered at one-off events across 19 countries, more than nine in ten said they would be willing to volunteer again 1. A past volunteer knows the mission, the site, and the work, and a program that reaches out is asking someone who has already said yes once. Real cost savings can follow from that, as every volunteer who comes back spares a program the work of finding, registering, and orienting someone new.
Across the 30 programs that had completed the Index by October 31, 2026, the foundations for implementing a successful re-engagement strategy are usually there. Twenty-one of 30 organizations report there is "a single place where all past volunteers' information lives," with names, contact details, and the date of each person's last shift being recorded. Many programs go even further, with 17 of 30 reporting that they use their records to answer basic impact questions, such as how many people they served and how many hours they gave, and 16 of 29 note each person's interests and preferred contact information.
But the strategy to put this information into action is usually missing. Just 10 of 27 programs have "a clear, intentional strategy for getting previous volunteers to become repeat volunteers," and only 13 of 30 agree that they "use the data we have collected to re-engage past volunteers." Just under a third of programs (9 of 28) have "a way to identify volunteers who've stopped engaging and reach out to them before assuming they're gone for good." This isn't unique to the Index: in a survey of 1,247 volunteer administrators across 36 countries, roughly a third said they track their annual volunteer retention rate 2.
Most programs keep a single record of their past volunteers, yet fewer than half use that data to bring them back.
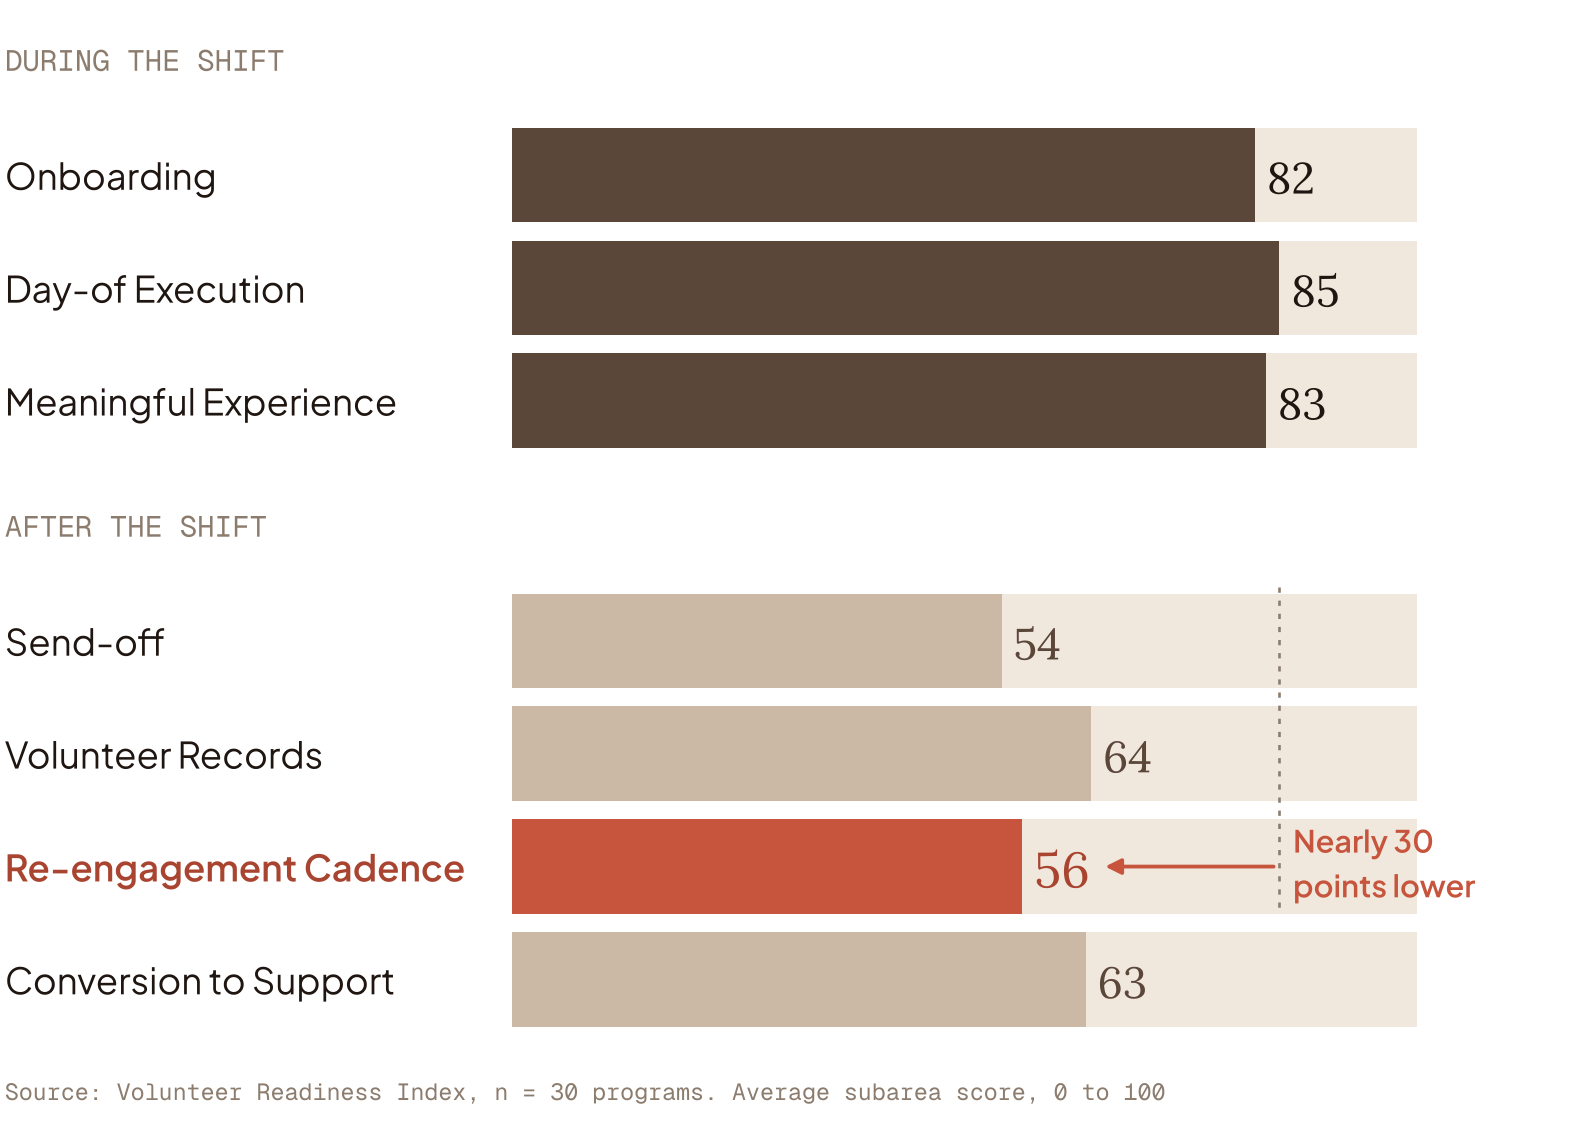
As a whole, Re-engagement Cadence, the subarea that covers this work, sits at an average score of 56, among the three lowest of the 18 subareas we measure. That is nearly 30 points below the shift itself, where Day-of Execution currently sits at 85.
Interestingly, this problem isn’t limited to smaller, less established programs. Whether a program is more or less than 15 years old, and whether its budget is above or below $250,000, most keep a single record of past volunteers, but fewer than half of those say they have a clear re-engagement strategy. Among the 18 programs that are more than 15 years old, for example, 12 keep a single record, but only 5 of them say they have a clear re-engagement strategy.
The gap is sharpest where the records are most personal. Of the 16 programs whose records note how each person prefers to be reached, only 8 use that data to bring anyone back. The Index statement that speaks most directly to volunteers in their twenties tells a similar story: just 15 of 30 programs regularly "keep a genuine connection with past volunteers between asks, reaching them on the channels they actually use and helping younger volunteers feel part of a community." For someone in their twenties, a program that knows how they like to be reached but never reaches out feels no different from one that never asked.
What is missing in most programs is not information. It is a plan that turns a list of names into a reason to reach out.
What this means for your program
Bringing people back doesn't require new software or a clever social media campaign. Most programs already have the information; they just need to build a habit of putting it to use. Consider:
- Pulling a list of previous volunteers this week. Sort your records by last shift and flag anyone who served in the past year but has not been back in the last 60 days.
- Asking them before you advertise to first-timers. Before posting holiday shifts publicly, send each flagged volunteer a short, personal invitation to a specific date, through whichever channel they use to reach you, rather than adding them to the next newsletter.
- Keeping track of who says yes. Add one column to the same list and note who said yes, who showed up and who never replied. By January, you will have a better sense of your own return rate, something only about a third of volunteer managers track 2.
- Making it a routine, not just a holiday push. Once the season ends, put the same check on the calendar for the first Monday of every month: one person, 15 minutes, a sort by last shift and a personal note to anyone who has gone quiet. Write those steps down. Fewer than half of the programs in the Index have a clear strategy for bringing volunteers back, and this would be yours.
In a 2022 national survey of 1,210 nonprofit leaders, 84 percent called keeping current volunteers "very important," and nearly half said recruiting enough volunteers was a "big problem" 3. Yet when asked how they had adapted their volunteer programs since the pandemic, two of the three changes leaders most often reported were aimed at reaching more people: more promotion on social media and outreach to new communities 3.
But our data points to a different place to start. Ultimately, as the holidays bring a fresh wave of shifts to fill and programs set their recruitment plans for the season, many of the people most likely to say yes are already on their list.
As of October 31, 2026 · 30 programs. Figures are fixed at publication; the Findings chart shows current numbers.
Sources
- Compion, S. et al., _Repeat and Non-returning Volunteers: The Promise of Episodic Events for Volunteer Recruitment and Retention, Voluntas (2022). Survey of event volunteers in 19 countries; measures willingness to volunteer again, not actual return.
- Tobi Johnson & Associates (VolunteerPro), _2023 Volunteer Management Progress Report (January 2023). Survey of 1,247 volunteer administrators in 36 countries.
- Dietz, N. and Grimm, R. T., _The State of Volunteer Engagement: Insights from Nonprofit Leaders and Funders (Do Good Institute, University of Maryland, February 2023). Survey of 1,210 U.S. nonprofit leaders, 2022.