This holiday season, most volunteer programs have no plan for a volunteer’s second visit
Programs score Strong during the shift itself, but drop to just Functional on nearly everything that happens after.
By Jalen A. Small · · Data as of October 23, 2026 · n = 25
Context
As we approach the holiday season, when supply drives, meal services and community events bring a new round of volunteers through the door, many will show up somewhere new for the first time. November is one of the busiest months of the year for volunteering, according to VolunteerMatch 1.
After investing effort to recruit and engage new volunteers during this busy season, organizations have every reason to retain them. But do they have a plan for ensuring a second visit? In one national study, nearly a third of Americans who volunteered one year did not volunteer the next 2. Data from the Index points to a noticeable gap where these newcomers are likely to be lost.
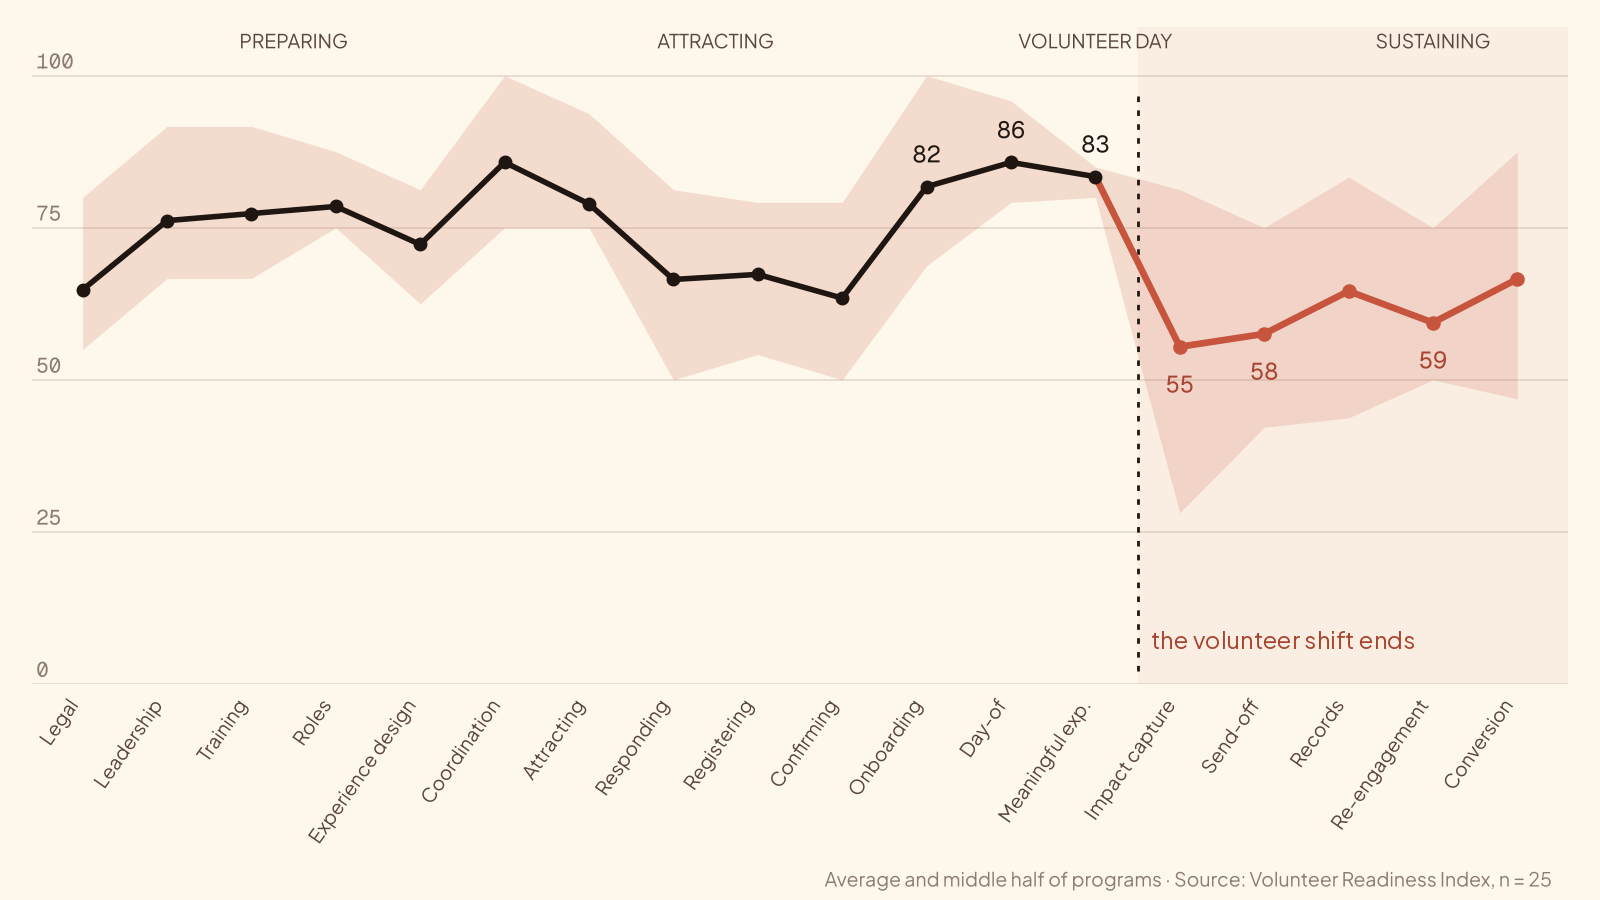
Across the 25 programs that have completed the Index, average scores run in the low to mid 80s for subareas that cover the shift itself, with Onboarding at 82, Day-of Execution at 86, and Meaningful Experience at 83. But these scores plummet the moment the shift is over: down more than 25 points for the next two areas, 55 for Impact Capture and 58 for Send-off, which are the two lowest areas in the entire Index, before settling in the high 50s and 60s for everything a program does to stay in touch with volunteers afterward. Every area after the shift, from Impact Capture through Conversion, scores below every area of the shift itself (averaging 61, compared to 84 for the three areas related to the actual shift).
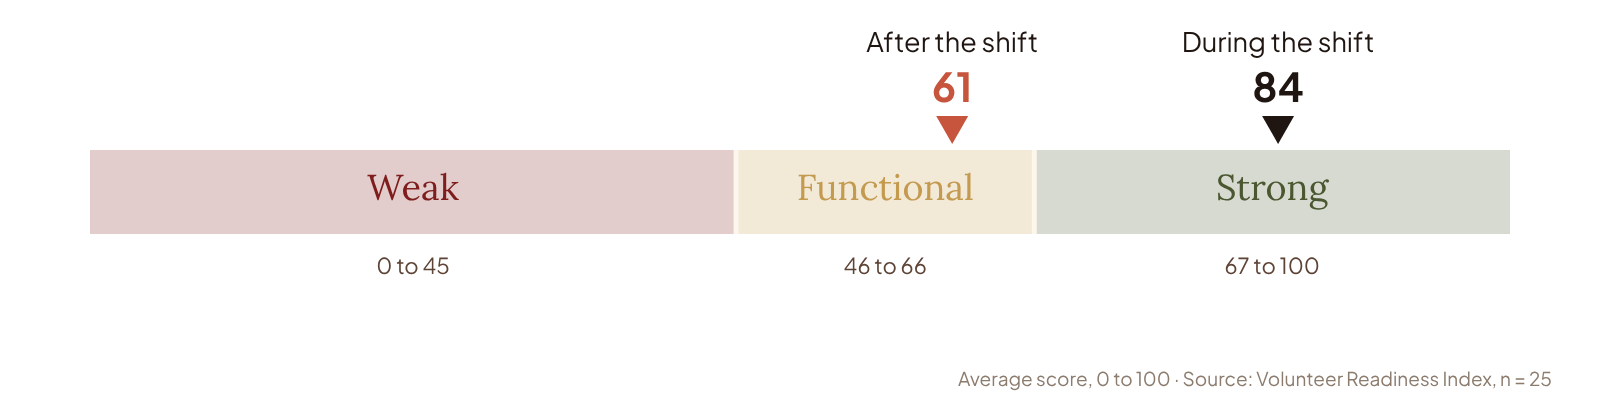
Most programs deliver a strong shift experience, yet fewer than half regularly follow up with volunteers afterward.
This isn’t just true for organizations that scored lower overall. Diving into the data, twenty-two of the 25 programs scored lower in the areas following the shift than in the shift itself. A closer look at the five areas after the shift shows that most programs keep their volunteer records in one place (17 of 25 rate their recordkeeping a 4 or 5), yet far fewer use those records to bring people back (11 of 25), and only 9 of the 23 that answered have an established plan for turning first-timers into regular volunteers. Similarly, most programs track what volunteers produce during a shift (14 of 24), but only 10 make sure volunteers leave with something that shows what they did.
This lack of continuity may show up in small ways that add up over time. The last few minutes of a shift are often when a first-time volunteer decides whether the day was a one-off or the start of a longer relationship. As Figure 2 shows, the step-down begins as the shift ends: more than a third of programs (9 of 24) don’t consistently give volunteers a specific next step before they leave, such as a date to come back.
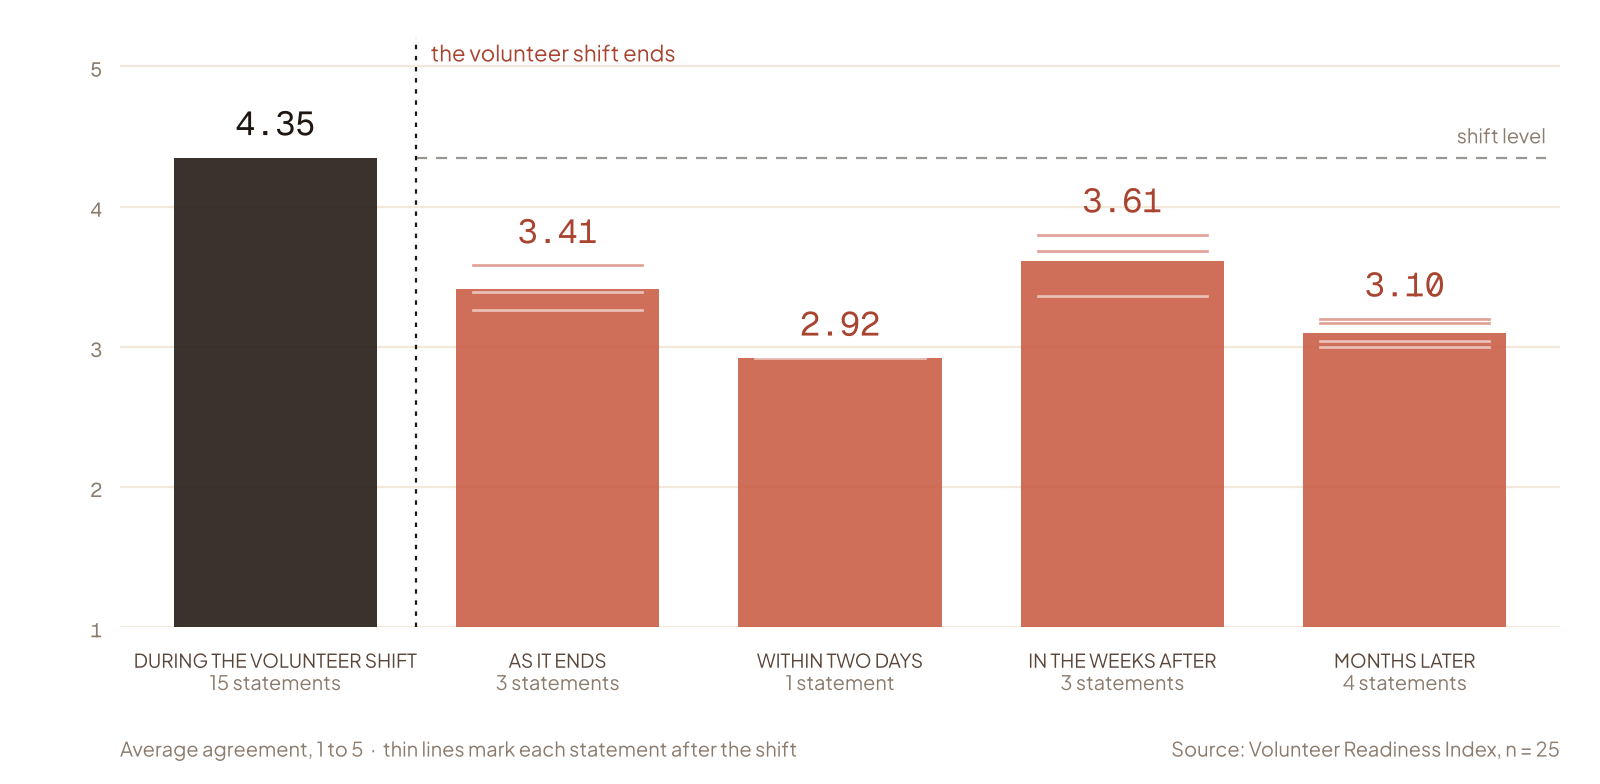
Small gaps like these may weigh heaviest on younger volunteers. In a 2026 national survey of U.S. donors, 90% of Gen Z said they had brought someone else into a cause, compared with 34% of Baby Boomers 3, and in a separate survey of volunteers aged 13 to 25, 62% said they value being celebrated and acknowledged 4. Yet only 9 of 23 programs regularly ask past volunteers to bring friends, and only 10 of 24 send a thank-you message within two days.
Together, these findings describe programs that already have most of what they need to keep volunteers but often fail to put it to work. The foundation for strong volunteer retention exists; what hasn’t formed yet is the habit of systematizing follow-up to close those small gaps before they add up.
What this means for your program
The good news is that these gaps are mostly a matter of habit, not budget, and this year's calendar is on organizations’ side. VolunteerMatch finds that January brings its highest rate of people actually committing to volunteer 1, which makes the weeks between a holiday shift and the new year the best chance most programs will have to turn first-timers into regulars.
Three small habits fit inside that window:
- In the last ten minutes of every shift, thank people as a group, name one thing they accomplished together, and give them a specific date to come back, along with an invitation to bring a friend, which Gen Z volunteers are especially likely to act on 3.
- Maintain a record of the contact info of all volunteers, in one shared spreadsheet or sign-in sheet with each person’s name, phone or email, and the date they came, so you can reach them again.
- Within two days, send every volunteer a short, personal thank-you, while the warmth of the shift still has somewhere to go.
None of these require new software or new staff. If your own Index results show Send-off, Impact Capture or Re-engagement Cadence among your lowest areas, this is the place to begin.
These small habits can make a huge difference for first-time volunteers who walk through the door for a holiday shift. A national study of U.S. charities found that recognizing volunteers was one of three management practices tied to higher retention 5, and in federal survey data, 41% of volunteers got involved simply because someone asked them 6. Asking a past volunteer to come back is free, takes minutes, and may be one of the most underused tools a volunteer program has.
Ultimately, the holidays are about to send many programs a fresh group of volunteers, and the ones who said yes to a first visit are the best candidates for becoming regulars.
As of October 23, 2026 · 25 programs. Figures are fixed at publication; the Findings chart shows current numbers.
Sources
- VolunteerMatch (2018). The best days and times to recruit volunteers. Republished by Idealist.
- Corporation for National and Community Service (2007). Volunteering in America: 2007 state trends and rankings in civic life. As reported in The Chronicle of Philanthropy.
- Tiltify Catalyst (2026). American Giving Index, Q2 2026. National survey of 1,000 U.S. donors, July 2026.
- American Red Cross and DoSomething Strategic (2024). The state of Gen Z volunteerism 2024. Survey of 1,310 volunteers aged 13 to 25.
- Hager, M. A., and Brudney, J. L. (2004). Volunteer management practices and retention of volunteers. Urban Institute.
- U.S. Bureau of Labor Statistics (2015). Volunteering in the United States, 2014. U.S. Department of Labor.